

2 Room Acoustic Treatments
Characterisation, Measurement & Prediction

Part A — Reading the room
(qualitative characterisation)
A.1 | Room 1: Staircase HIL


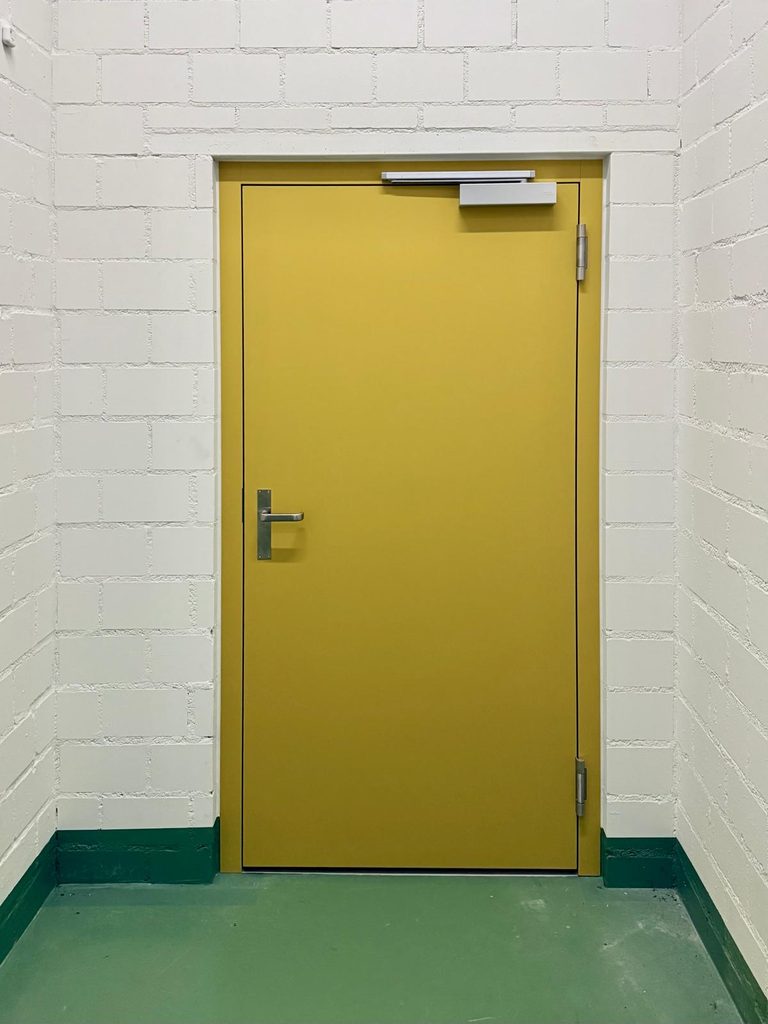
Acoustic absorbers: The stairwell does not contain any acoustically treated surfaces, there are no surfaces that would absorb sounds. I expect almost no absorption on all frequency levels. Although the walls have mortar joints, which might act as acoustic diffusers, their impact due to their size can be assumed negligible.
Notable Room Geometry: However, the unique geometrical shape of the room (not a flat corridor but a staircase that has a mix of risers and treads) provides significant geometric scattering. The overall shape of the stairwell (connecting diagonally two floors) is definitely worth noting down.
One can assume than almost 100% of the interior surface area is highly reflective:
– Smooth, non-porous coated concrete floor and treads
– Painted, sealed masonry brick walls
– Solid, raw concrete ceiling
– Painted sheet metal fire door
Reverberation character: This space is very live, echoey, and harsh. It can be characterized by prolonged reverberation, sharp high-frequency slapbacks between parallel walls, and loud sounds of foot steps.
A.2 | Room 2: Lecture Hall HIL


The primary acoustically effective elements are concentrated on the ceiling and the floor of the main student area.
Ceiling Panels: The ceiling features a suspended grid of white, perforated cassettes. The perforations are the same size across the panels. These metal panels are most likely backed with an acoustic fleece or mineral wool. They act as broadband absorbers: the perforations effectively trap high- and mid-frequency sound waves.
Floor Covering: A dark grey, dense-pile carpet covers the floor beneath the student desks. This material primarily absorbs very high-frequency sounds and is crucial for limiting impact noise, such as footsteps and scraping chairs.
Wall Treatments: There is a light, metal surface on the walls. While mostly reflective, this slight texture may offer very marginal high-frequency absorption compared to completely smooth plaster.
Furnishings Favouring Diffuse Reflection: The room does not contain specialized acoustic diffusers. However, the standard furnishings scatter sound to some degree. The staggered arrangement of the white desks and the curved, dark wooden backs of the chairs break up flat surfaces, providing random diffusion that helps prevent flutter echoes near the ground level.
Notable Room Geometry: The room is of a standard rectangular geometry with parallel surfaces (opposing side walls, front and back walls, floor and ceiling). There is a step higher surface in the front of the room, where the chalk board is. This helps for the speaker to stand higher so that also their voice can travel above the heads of the audience further to the space.
In the absence of acoustic treatment, this box-like shape would be highly prone to flutter echoes and standing waves.
This space is noticeably dead, crisp, and balanced. It is characterized by controlled, short reverberation from the perforated ceiling panels, covering the whole ceiling surface, and carpet, ensuring high speech recognition without being excessively boomy or echoey.
Part B — Measuring the room
(empirical RT60)
B.1 | Room 1: Staircase HIL

In the stairwell, I was able to read out a 30 dB decay. The time needed for the clap sound to decay in 30 dB is 1.75 – 0.75 = 1 second. For the RT60, it would then equal to 2*1 sec = 2 seconds. The measured reverberation time in this space would then be 2 seconds.
There are no clearly visible echoes in the decay.
B.2 | Room 2: Lecture Hall HIL

In the lecture hall, I was also able to read out a 30 dB decay. The time needed for the clap sound to decay in 30 dB is 0.475 – 0.125 = 0.35 second. For the RT60, it would then equal to 2*0.35 sec = 0.7 seconds. The measured reverberation time in this space would then be 0.7 seconds.
There are no clearly visible echoes in the decay.
Part C — Calculating a prediction
(Sabine equation)
For the following part, Sabine’s equation: RT60 = 0.161 × V / A will be used.
C.1 | Room 1: Staircase HIL

C.1.1 | Volume of the room
(b+d)*H*W + c*H1*W = (2.3 + 2.8)*3*1.7 + 7.9*2.8*1.7 = 63.6 m3
C.1.2 | Surfaces

| Position | Material | Surface shortcuts | Total surface |
| Ceiling | Exposed concrete | S13 | 22.1 |
| Floor | Smoothly painted concrete | S14 | 22.1 |
| Wall | Painted concrete blocks | S15 = 2*(S10+S11+ S12) | 78 |
| Furniture | – |
C.1.3 | Coefficients
| α | 500 Hz | 1000 Hz | |
| Smoothly painted concrete | α1 | 0.02 | 0.02 |
| Exposed concrete | α2 | 0.01 | 0.02 |
| Painted concrete blocks | α3 | 0.06 | 0.07 |
C.1.4 | Sabine equation 500 Hz
RT60 = 0.161 × V / A
RT60 = 0.161 × V / Σ (S × α)
RT60 = 0.161 * V / (S13*α2 + S14*α1 + S15*α3)
RT60 = 0.161 * 63.6 / (22.1*0.01 + 22.1*0.02 + 78*0.06)
RT60 (500 Hz) = 1.92 sec
C.1.5 | Sabine equation 1000 Hz
RT60 = 0.161 × V / A
RT60 = 0.161 × V / Σ (S × α)
RT60 = 0.161 * V / (S13*α2 + S14*α1 + S15*α3)
RT60 = 0.161 * 63.6 / (22.1*0.02 + 22.1*0.02 + 78*0.07)
RT60 (1000 Hz) = 1.61 sec
C.1.6 | Online check
Measured value via online tool Acouso was:
RT60 (500 Hz) = 1.79 sec
RT60 (1000 Hz) = 1.51 sec
Room 2: Lecture Hall HIL

C.2.1 | Volume of the room
a*b*H = 11*9.5*3 = 313.5 m3
C.2.2 | Surfaces
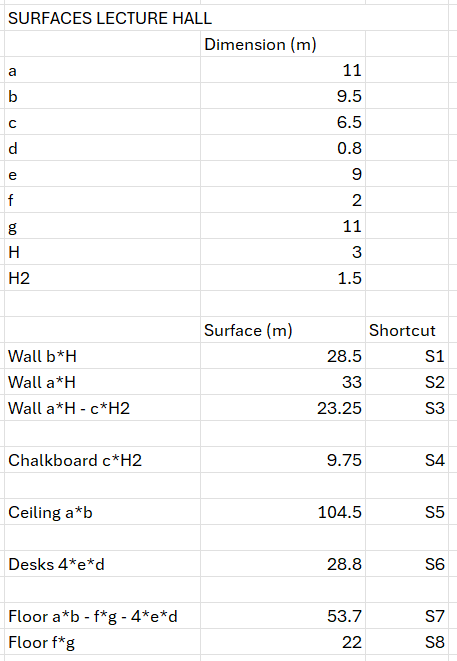
| Position | Material | Surface shortcuts | Total surface (m2) |
| Wall | Chalk-board | S4 | 9.75 |
| Ceiling | Acoustic panels | S5 | 104.5 |
| Furniture | Desks | S6 | 28.8 |
| Floor | Carpet on concrete | S7 | 53.7 |
| Floor | Linoeum | S8 | 22 |
| Wall | Metal panels | S9 = 2*S1+S2+S3 | 113.25 |
C.2.3 | Coefficients
| α | 500 Hz | 1000 Hz | |
| Chalkboard | α1 | 0.04 | 0.03 |
| Acoustic panels | α2 | 0.65 | 0.70 |
| Desk material (laminate) | α3 | 0.06 | 0.06 |
| Carpet on concrete | α4 | 0.14 | 0.35 |
| Linoleum | α5 | 0.03 | 0.03 |
| Metal panels | α6 | 0.04 | 0.04 |
C.2.4 | Sabine equation 500 Hz:
RT60 = 0.161 × V / A
RT60 = 0.161 × V / Σ (S × α)
RT60 = 0.161 * V / (S4*α1 + S5*α2 + S6*α3 + S7*α4 + S8*α5 +S9*α6 )
RT60 = 0.161 * 313.5 / (9.75*0.04 + 104.5*0.65 + 28.8*0.06 + 53.7*0.14 + 22*0.03 + 113.25*0.04)
RT60 (500 Hz) = 0.61 s
C.2.5 | Sabine equation 1000 Hz:
RT60 = 0.161 × V / A
RT60 = 0.161 × V / Σ (S × α)
RT60 = 0.161 * V / (S4*α1 + S5*α2 + S6*α3 + S7*α4 + S8*α5 +S9*α6 )
RT60 = 0.161 * 313.5 / (9.75*0.03 + 104.5*0.70 + 28.8*0.06 + 53.7*0.35 + 22*0.03 + 113.25*0.04)
RT60 (1000 Hz)= 0.51 s
C.2.6 | Online check
Measured value via online tool Acouso was:
RT60 (500 Hz) = 0.66 sec
RT60 (1000 Hz) = 0.42 sec
Part D — Compare and reflect
D.1 | Room 1: Staircase HIL
| RT60 | 500 Hz | 1000 Hz |
| Predicted (Part A) | 2-3 sec | 2-3 sec |
| Measured (Part B) | 2 sec | 2 sec |
| Calculated — Sabine (Part C) | 1.92 sec | 1.61 sec |
| Calculated — online tool (Part C) | 1.79 sec | 1.51 sec |
D.1.1 | Conclusion
Upon investigating the conditions in this stairwell and spending time in the room, I anticipated the reverberation time to be somewhere between two and three seconds. The graphical analysis of the recorded impact sounds showed the reverberation time to be approximately two seconds, matching the anticipated range from Part A. When looking at the calculated values, the first differences emerge: the reverberation time for the lower frequencies (500 Hz) almost matches the measured value. The 0.4-second difference between the measured and calculated values for 1000 Hz does not necessarily show an error; because Part B does not differentiate between frequency types, the higher frequencies likely died out sooner in the space, while the visual decay slope simply reflected the slowest-decaying modes rather than the true 1000 Hz decay.
Beyond this frequency mismatch, several factors explain the gap between calculated and measured values:
- Measurement limitations: Ambient noise in the building limited the usable dynamic range, preventing a full 60 dB decay reading and forcing an estimate (T30), where drawing the regression line introduces manual error.
- Non-diffuse room behavior: Sabine’s formula assumes a completely diffuse, homogeneous sound field. Because the stairwell is an elongated duct, sound energy channels along the stairs and sets up harsh flutter echoes between the bare, parallel masonry walls.
- Material coefficients: Tabular absorption values (α) represent idealized averages; paint layers, sealed concrete finishes, and scattering from the stepped tread edges deviate from standard Sabine estimates.
Comparing the manual calculation and online tool, there is a slight shift in values. The online tool shows shorter reverberation times than the manual calculations across both frequencies. This is explained by the complex geometry (combining diagonal and flat segments): the online room model produced a total surface area of 127 m², whereas the manual calculation estimated closer to 122 m². This larger surface area increases the total equivalent absorption area A, which directly decreases the resulting RT0 in Sabine’s equation (RT60 = 0.161 × V / A).
D.2 | Room 2: Lecture Hall HIL
| RT60 | 500 Hz | 1000 Hz |
| Predicted (Part A) | 1 sec | 1 sec |
| Measured (Part B) | 0.7 sec | 0.7 sec |
| Calculated — Sabine (Part C) | 0.61 sec | 0.51 sec |
| Calculated — online tool (Part C) | 0.66 sec | 0.42 sec |
D.2.1 | Conclusion
The predicted reverberation time I anticipated in this lecture hall was around 1 second. When listening to an impulse decay without measurement tools, I considered one second the smallest intuitive benchmark I can mentally count out. This value is not so far from the measured and calculated values; here the RT60 data ranges from 0.4 to 0.7 seconds, which only narrows down the RT60 and explains the advanced precision that my ear could not identify.
An ideal reverberation time for a speech-focused lecture hall is, according to online sources, between 0.6 to 0.9 seconds. This puts the resulting values onto a relatable scale.
Comparing Part C to Part B, there is a 0.09 s difference at 500 Hz (0.70s measured vs. 0.61s calculated). Because the microphone setup recorded an unfiltered broadband impulse, the measured decay of 0.7s was entered identically for both frequencies. Consequently, the visual slope is dictated by the slowest-decaying modes around 500Hz, making this the relevant band for comparison.
The difference between 0.7 second and 0.6 seconds can be explained with the idealization of the room when it comes to the absorbing and reflective surfaces. For example, the desks are elevated ca 80cm into the space from the ground, but for the calculation, they were considered as a part of the floor surface, taking away from the absorbent carpet surface. Similarly, the surfaces of the chairs were not considered, which also affect the precision of the results.
The values resulting from the online tool check also vary from the manually calculated values. Because the online tool restricts each boundary plane to a single material, local elements like the front linoleum strip, chalkboard, and laminate desks were omitted. Simplifying entire floor to be covered with carpet then drastically decreased the length of reverb at 1000 Hz frequencies, since the coefficient for carpet is 0.35 and linoleum only 0.03. Adding these reflective materials in the manual calculation provided a more complex and more precise estimate for the room than the simplified online check. Similarly, replacing the desk surfaces surfaces (α=0.06) entirely with carpet (α=0.14 and α=0.35) had an effect on RT60 across both octave bands.
Possible adjustment of acoustic treatment
Between the two rooms, the stairwell would benefit most from acoustic treatment, as the lecture hall is already well optimized for speech. While the stairwell is only used for circulation, reducing its echo would improve speech clarity during emergencies. In order to achieve this, I propose adding sound-absorbing wall panels with fire-safe properties. This could be as mineral wool or wood-wool boards that provide enough absorption. Placing these panels high up on the opposite side walls would stop disturbing flutter echoes while keeping the lower walls safe from damage.